Natural-Language Search

Type a question, not a query

No indicator names, no menus, no chart settings to configure. Type a research question the way you'd ask a colleague — Xplore Search interprets it, finds the indicators that actually answer it, and renders them with the right chart type, countries and time range already set.
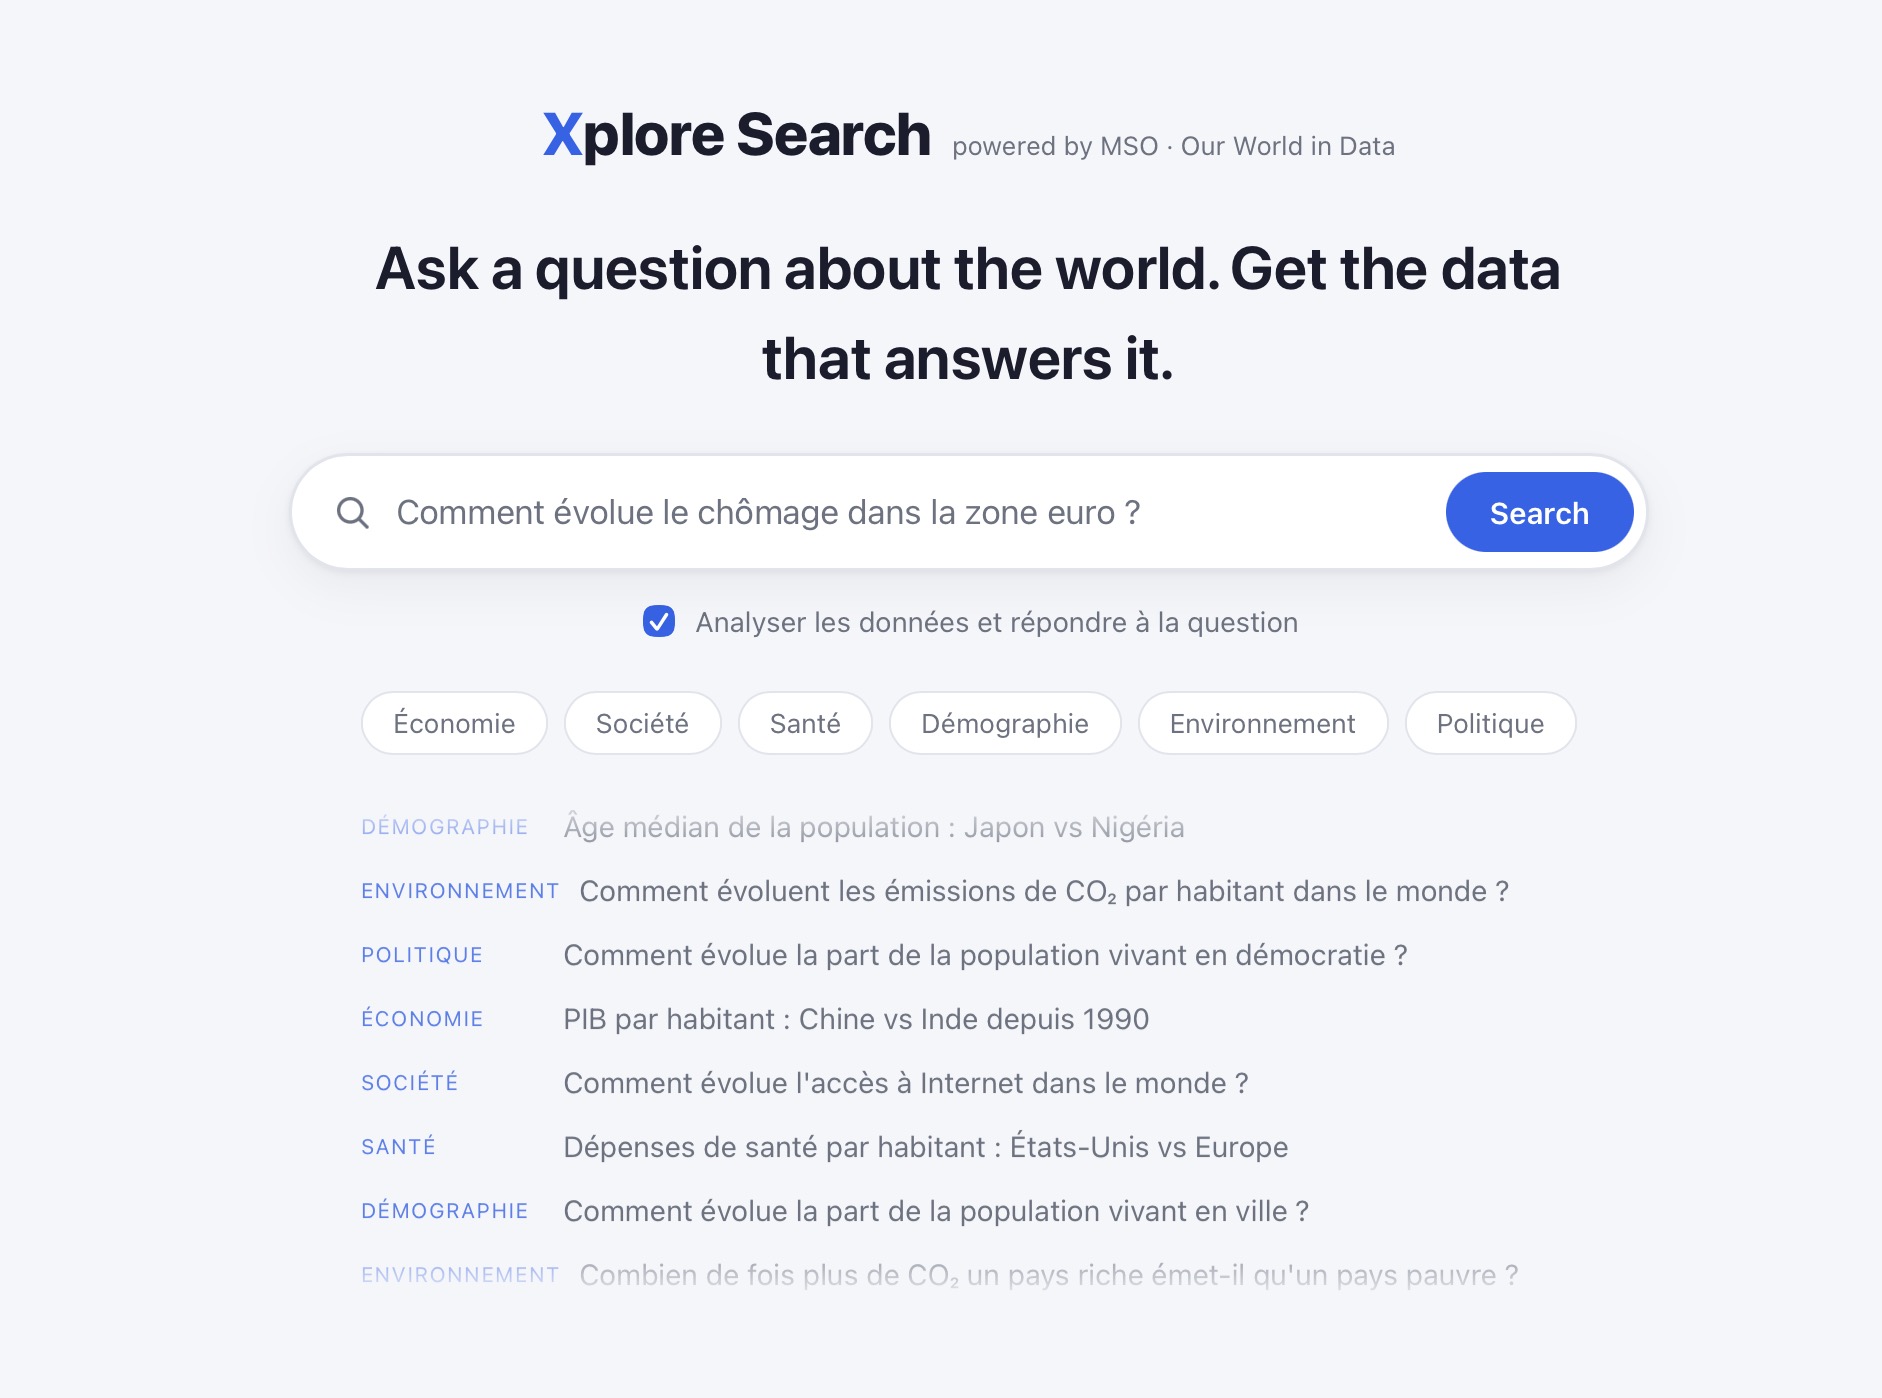
Xplore Search results page for a health spending question

One answer, several charts, no configuration

The search understands what's actually being asked — a trend over time, a ranking, a map, a comparison between countries or a relationship between two variables — and picks a chart type to match: time series, map, bar, slope or composition. Multiple complementary indicators are shown together when they each add something the others don't, with a short note on what each one contributes.
Time series Map Bar Slope Marimekko XY scatter
"Life expectancy in France since 1900" "Compare Nigeria and Kenya" "Energy consumption as a function of GDP" "Democracy in Europe"

Anti-Hallucination
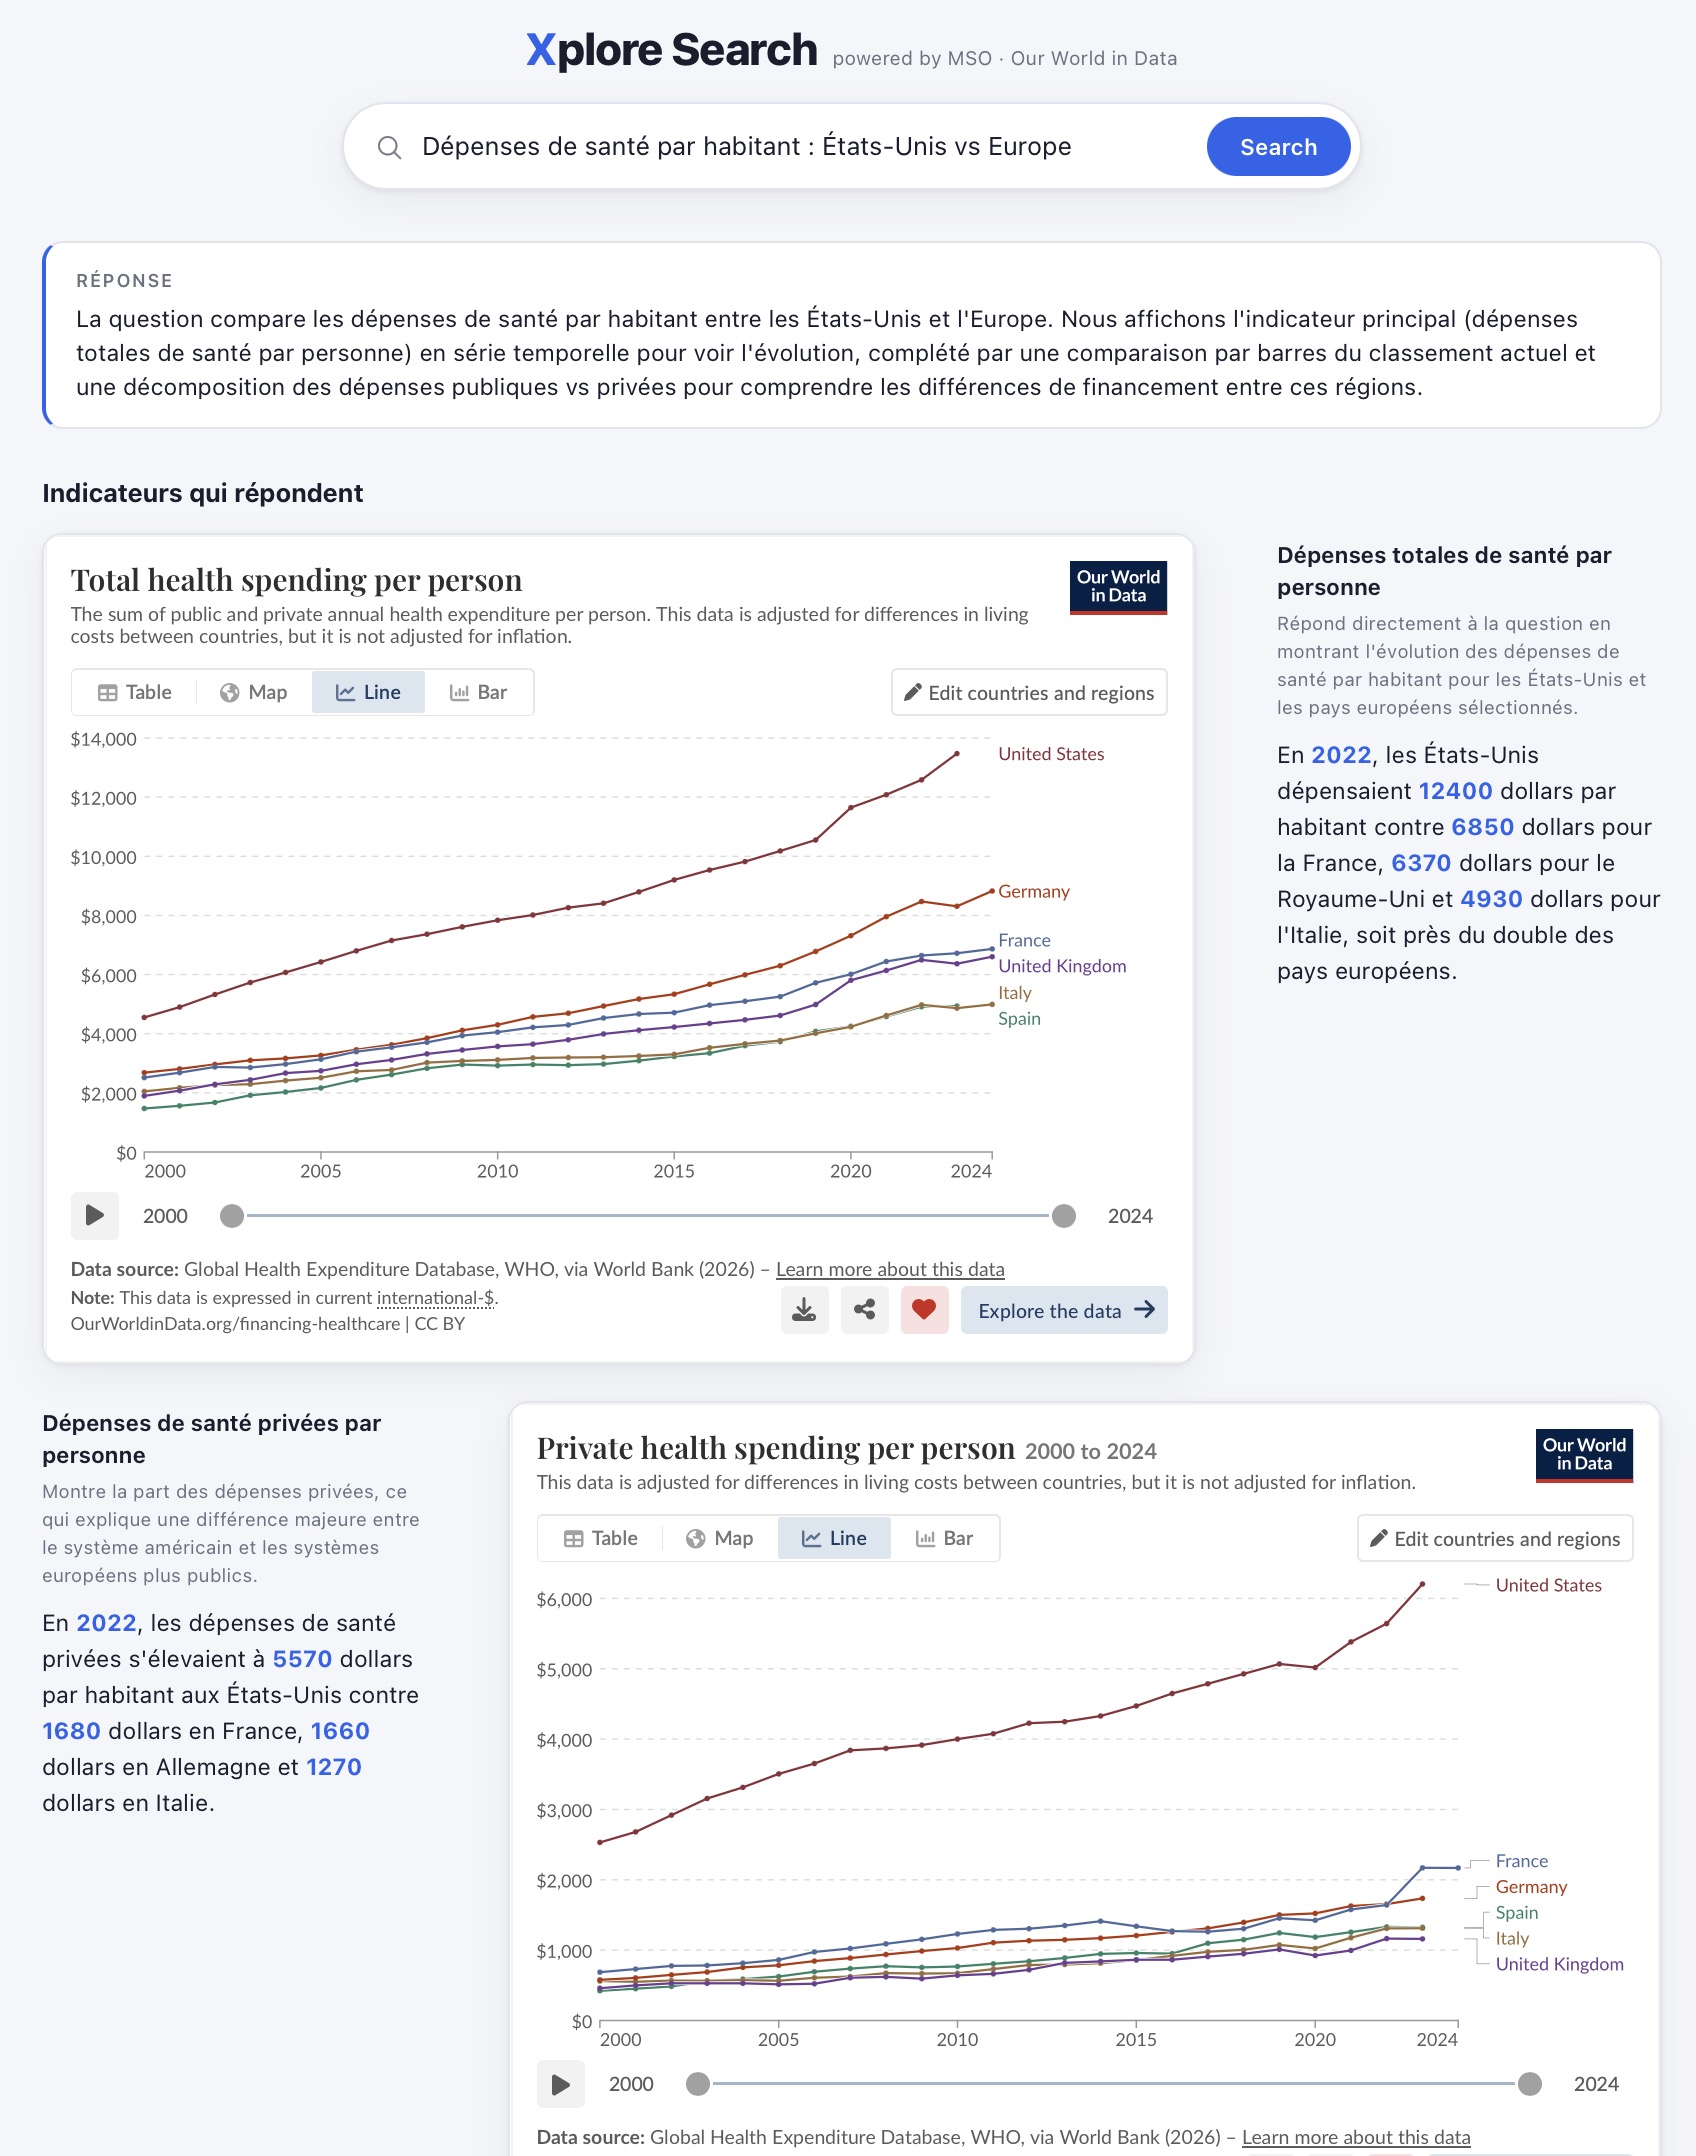
Grounded written answer next to a health spending chart

An answer, cited from the data — never invented

Every written statement is checked against numbers actually computed from the underlying dataset before it reaches the page. The model never estimates or recalls a figure from memory — if the data can't support a claim, it says so instead of guessing.


Numbers you can trust, on every chart

Real statistics — latest values, growth, country rankings — are computed first from the raw indicator data. The model is only allowed to write about those pre-computed numbers, one grounded sentence per chart, with key figures highlighted so the answer reads at a glance. When several charts are shown together, one grouped analysis pass covers all of them, comparing countries explicitly where relevant.


Pre-computed stats only Server-side guard Highlighted figures Multi-language

Two Variables

"X as a function of Y" → an XY explorer, automatically

Some questions aren't about a trend — they're about how two things relate. Xplore Search detects this pattern and builds a live two-variable explorer on the spot, no manual setup required.

Detects the relationship

"Energy consumption as a function of GDP", "life expectancy vs GDP per capita" — the model identifies the two indicators and which one is the independent variable.

Builds the explorer

A two-indicator Xplore explorer is created automatically in the background and opens directly on its XY scatter view — country-level correlations, ready to explore.

Deduplicated & shareable

Each explorer is named deterministically from its two indicators, so identical questions reuse the same public link instead of creating duplicates.


Contextual Chat

Keep asking — grounded in what's on screen

A search result isn't a dead end. A side panel lets you keep the conversation going about the charts currently displayed, with the same strict grounding discipline as the main search.

On-screen data

The charts you're looking at

Every follow-up answer draws on the indicators, countries and pre-computed statistics already shown on the page — not on general knowledge.

One Wikipedia lookup

Context for the "why"

For questions about causes or events behind a trend, a single targeted Wikipedia lookup supplies real-world context — always cited, never invented.

Strictly scoped

No open-ended browsing

No agentic loop, no unrestricted tool use — just two well-defined sources per answer, so the chat stays fast, cheap and predictable.

Built for cost and speed, not just capability

Xplore Search runs on tightly-scoped, single-shot model calls rather than an open-ended agent — each request stays in the low cents, and simple queries (a bare country name, for instance) skip the model call entirely and go straight to a pre-built dashboard of headline indicators.


Ask your first question

Xplore Search is available now — try it on any topic across economics, health, demography, energy, environment or governance.